Making Analyze CSS render 6 times faster
One of the main drivers for Project Wallace is performance. Not just analyzing the performance of CSS as you can see in our code quality tools, but also doing the work in a fast and efficient way. With all the extra analysis that we’ve added over the last year, the analyzer page started to become a little slow. Even though the analysis happens completely off the main thread using a WebWorker. But rendering the results on the page sometimes took longer than parsing and analyzing the CSS itself! So I set out to fix that and the result is that the CSS report now renders more than 6 times faster than before! Here’s what I found.
TL;DR;
- Render expensive components only when they are within the viewport
- Reduce the amount of DOM nodes
Setting a baseline
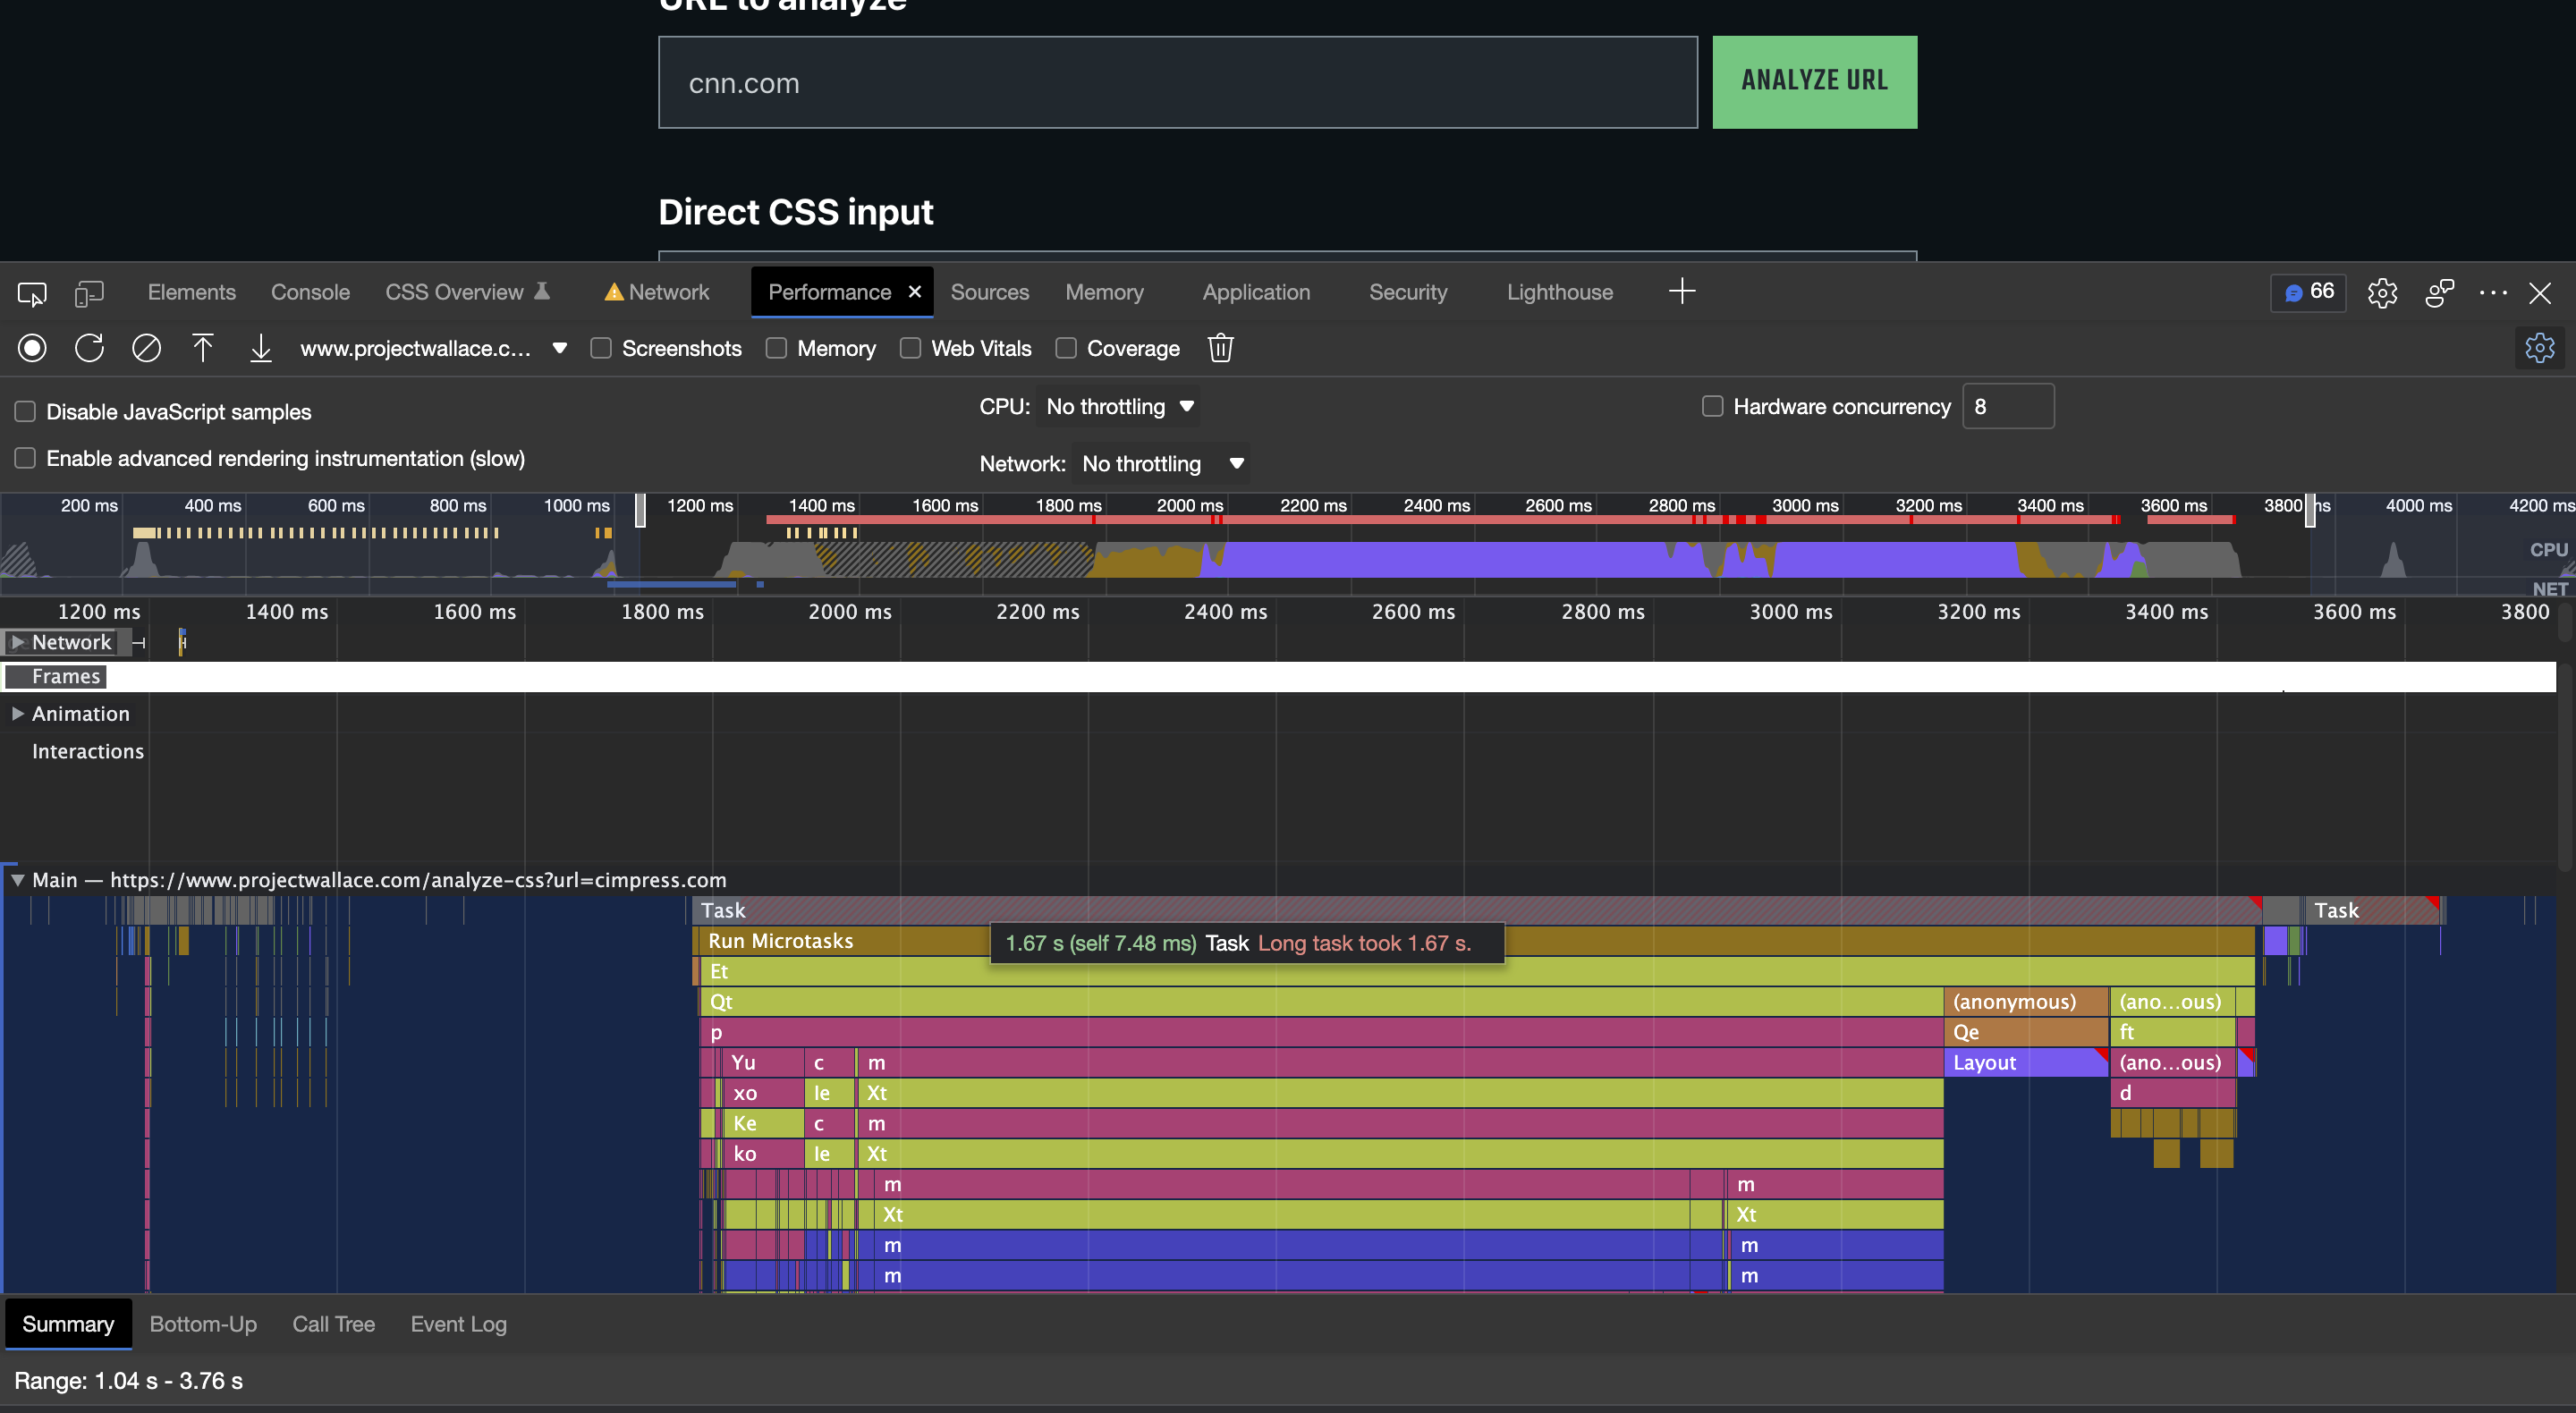
All test cases were run against the CSS of CNN.com, because it’s a large dataset (800+ kB), but also a pretty good representation of real-world CSS. Many websites out there are like CNN’s, with lots of unique colors, font-sizes, rules, everything.
Before any changes were made, rendering report took about 1.6 seconds.
The fixes
With this knowledge in mind, it’s time to take action.
Lazily rendering all ScatterPlots
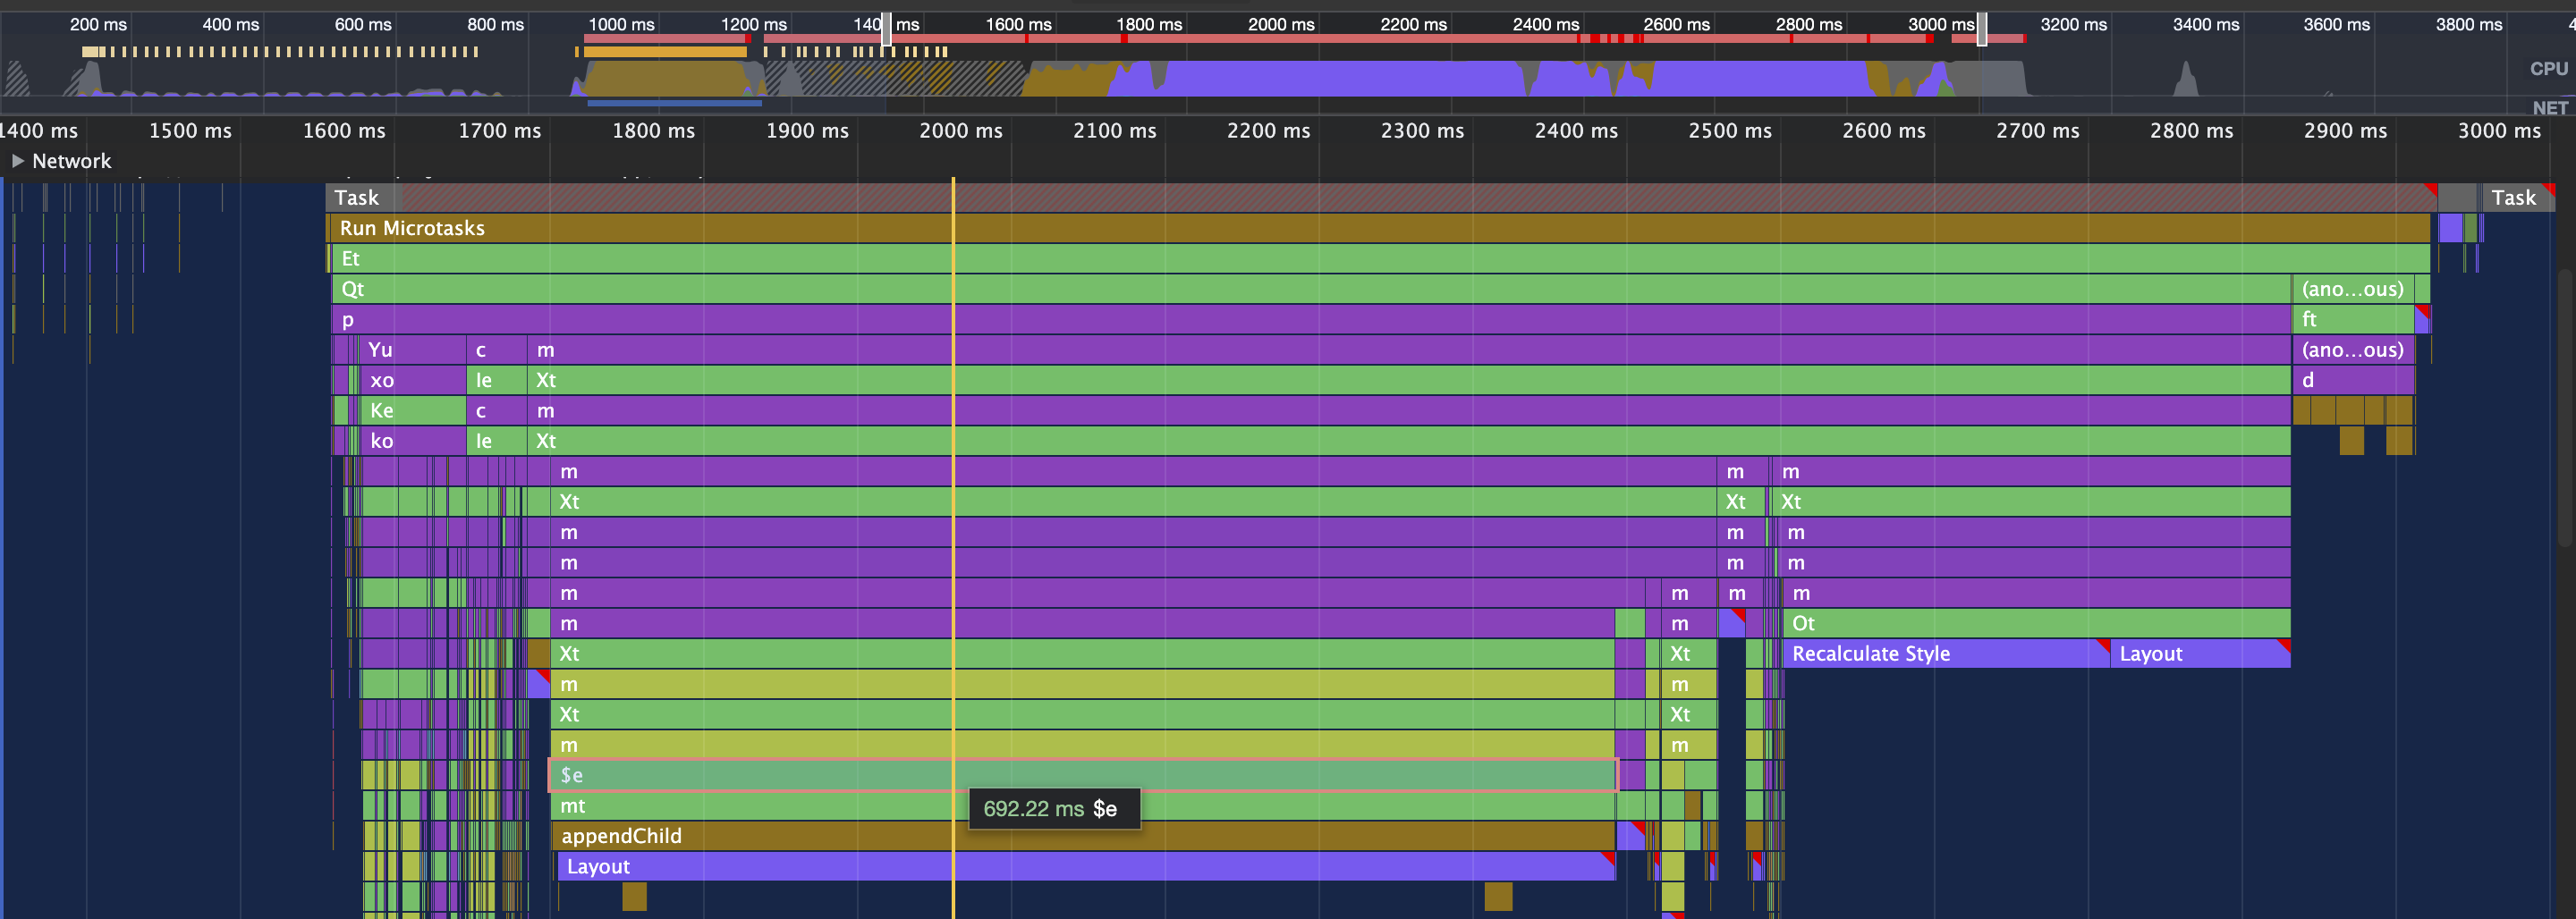
Zooming in shows that there is a single function ($e) that takes up almost 700ms to render. It turns out it’s one of the scatter plots that we use to show Ruleset and Selector complexity.
Here’s the offending scatterplot:
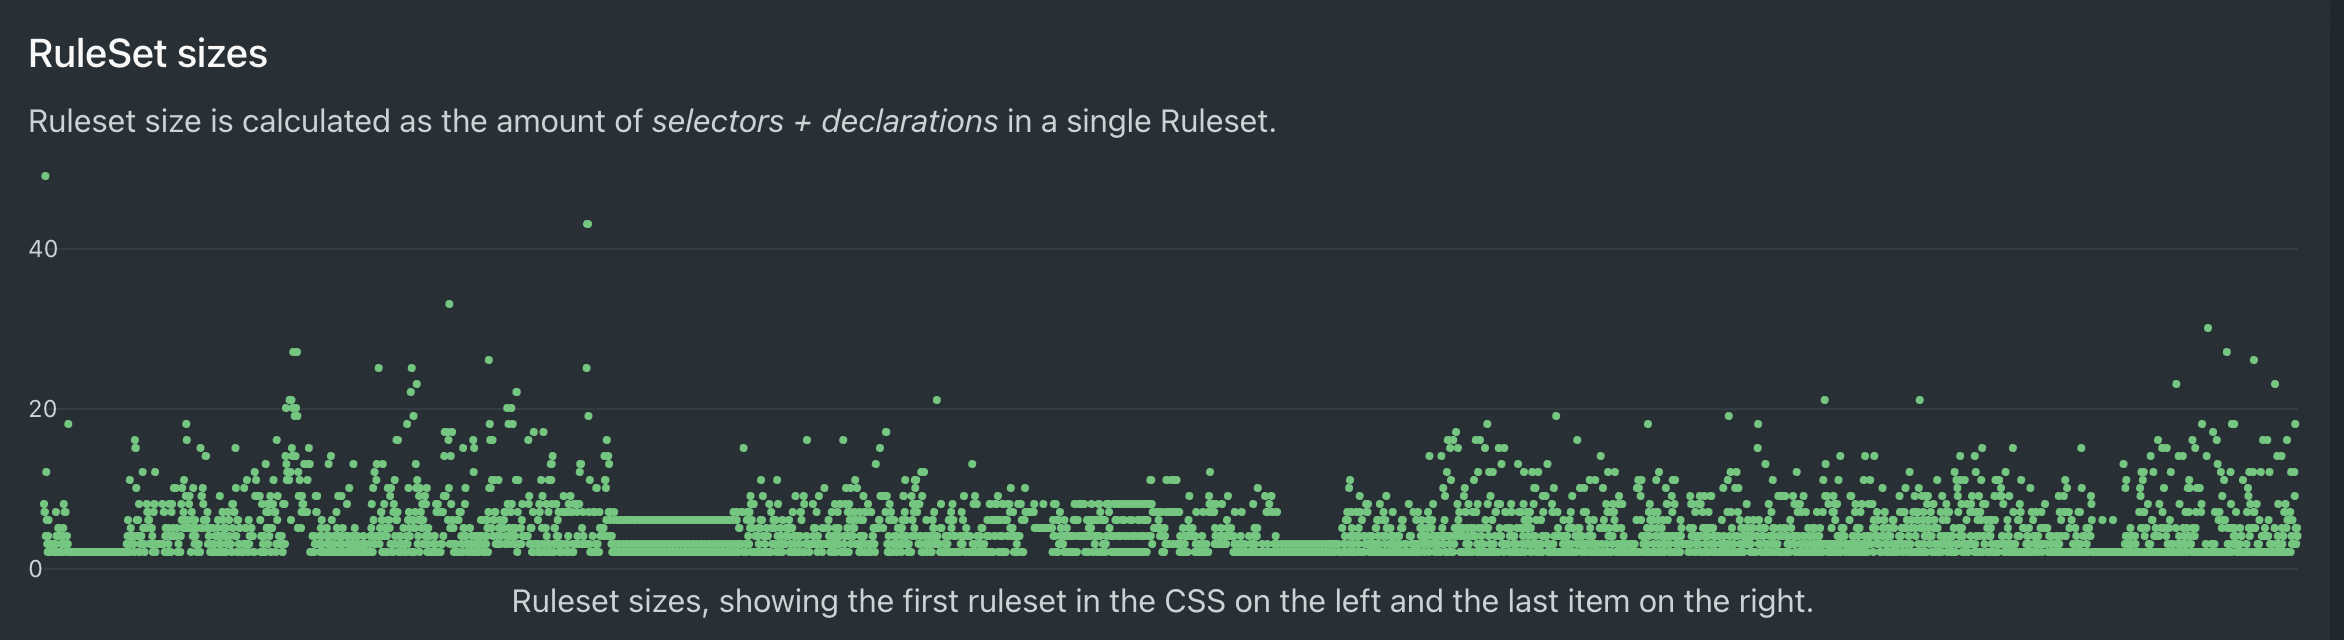
And this is just one. There are four of these in the report, so this is a good starting point to start optimizing.
Rendering all ScatterPlots at once turns out to be quite slow and here’s the catch: they’re not even shown immediately, because you have to scroll down to see them. So what if we only render the ScatterPlots when they’re inside the viewport? Support for IntersectionObservers is quite good these days, so it shouldn’t be too hard to implement.
There’s a pretty nice Svelte package to use IntersectionOberserver, so I installed it and tweaked the ScatterPlot.svelte code a little (abbreviated example):
ScatterPlot.svelte before
<!-- ScatterPlote.svelte (before) -->
<script>
	import * as Pancake from '@sveltejs/pancake'

	/** @type number[]*/
	export let points

	/** @type number */
	export let max
</script>

<div class="chart">
	<Pancake.Chart x1={0} x2={points.length} y1={0} y2={max}>
		{#if points.length > 0}
			<Pancake.Svg>
				<Pancake.SvgScatterplot data={points} let:d>
					<path class="dot" {d} />
				</Pancake.SvgScatterplot>
			</Pancake.Svg>
		{/if}
	</Pancake.Chart>
</div>

<style>.chart{height:200px}</style>
ScatterPlot.svelte after
<!-- ScatterPlote.svelte (after) -->
<script>
	import * as Pancake from '@sveltejs/pancake'
	import { inview } from 'svelte-inview'

	/** @type number[]*/
	export let points

	/** @type number */
	export let max

	let is_visible = false
</script>

<div class="chart" use:inview={{ unobserveOnEnter: true }} on:inview_enter={() => (is_visible = true)}>
	{#if is_visible}
		<Pancake.Chart x1={0} x2={points.length} y1={0} y2={max}>
			{#if points.length > 0}
				<Pancake.Svg>
					<Pancake.SvgScatterplot data={points} let:d>
						<path class="dot" {d} />
					</Pancake.SvgScatterplot>
				</Pancake.Svg>
			{/if}
		</Pancake.Chart>
	{/if}
</div>

<style>.chart{height:200px}</style>
What happened here?
- Add the svelte-inview package and create a single local variable called
is_visible - Make sure the chart element is being observed, so that we get a message when it’s scolled into view:
use:inview={{ unobserveOnEnter: true }} - When the element scrolls into view,
is_visibleis set totrue:on:inview_enter={() => (is_visible = true)} - Only when
is_visibleis true, the Pancake chart is rendered. - There is no layout shift, because the
.chartclass makes sure the element is always200pxtall.
That’s it! Only 5 lines of code added, for instant benefit.
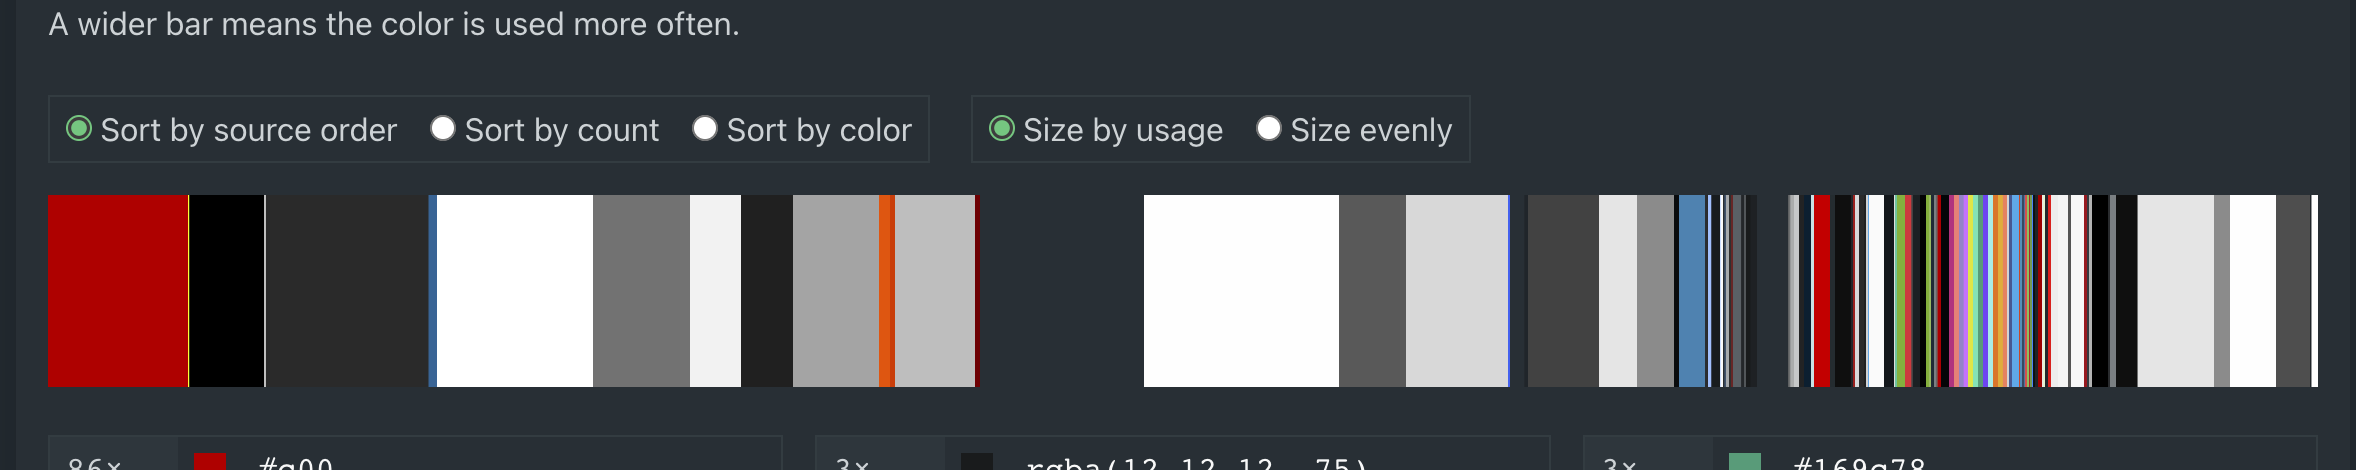
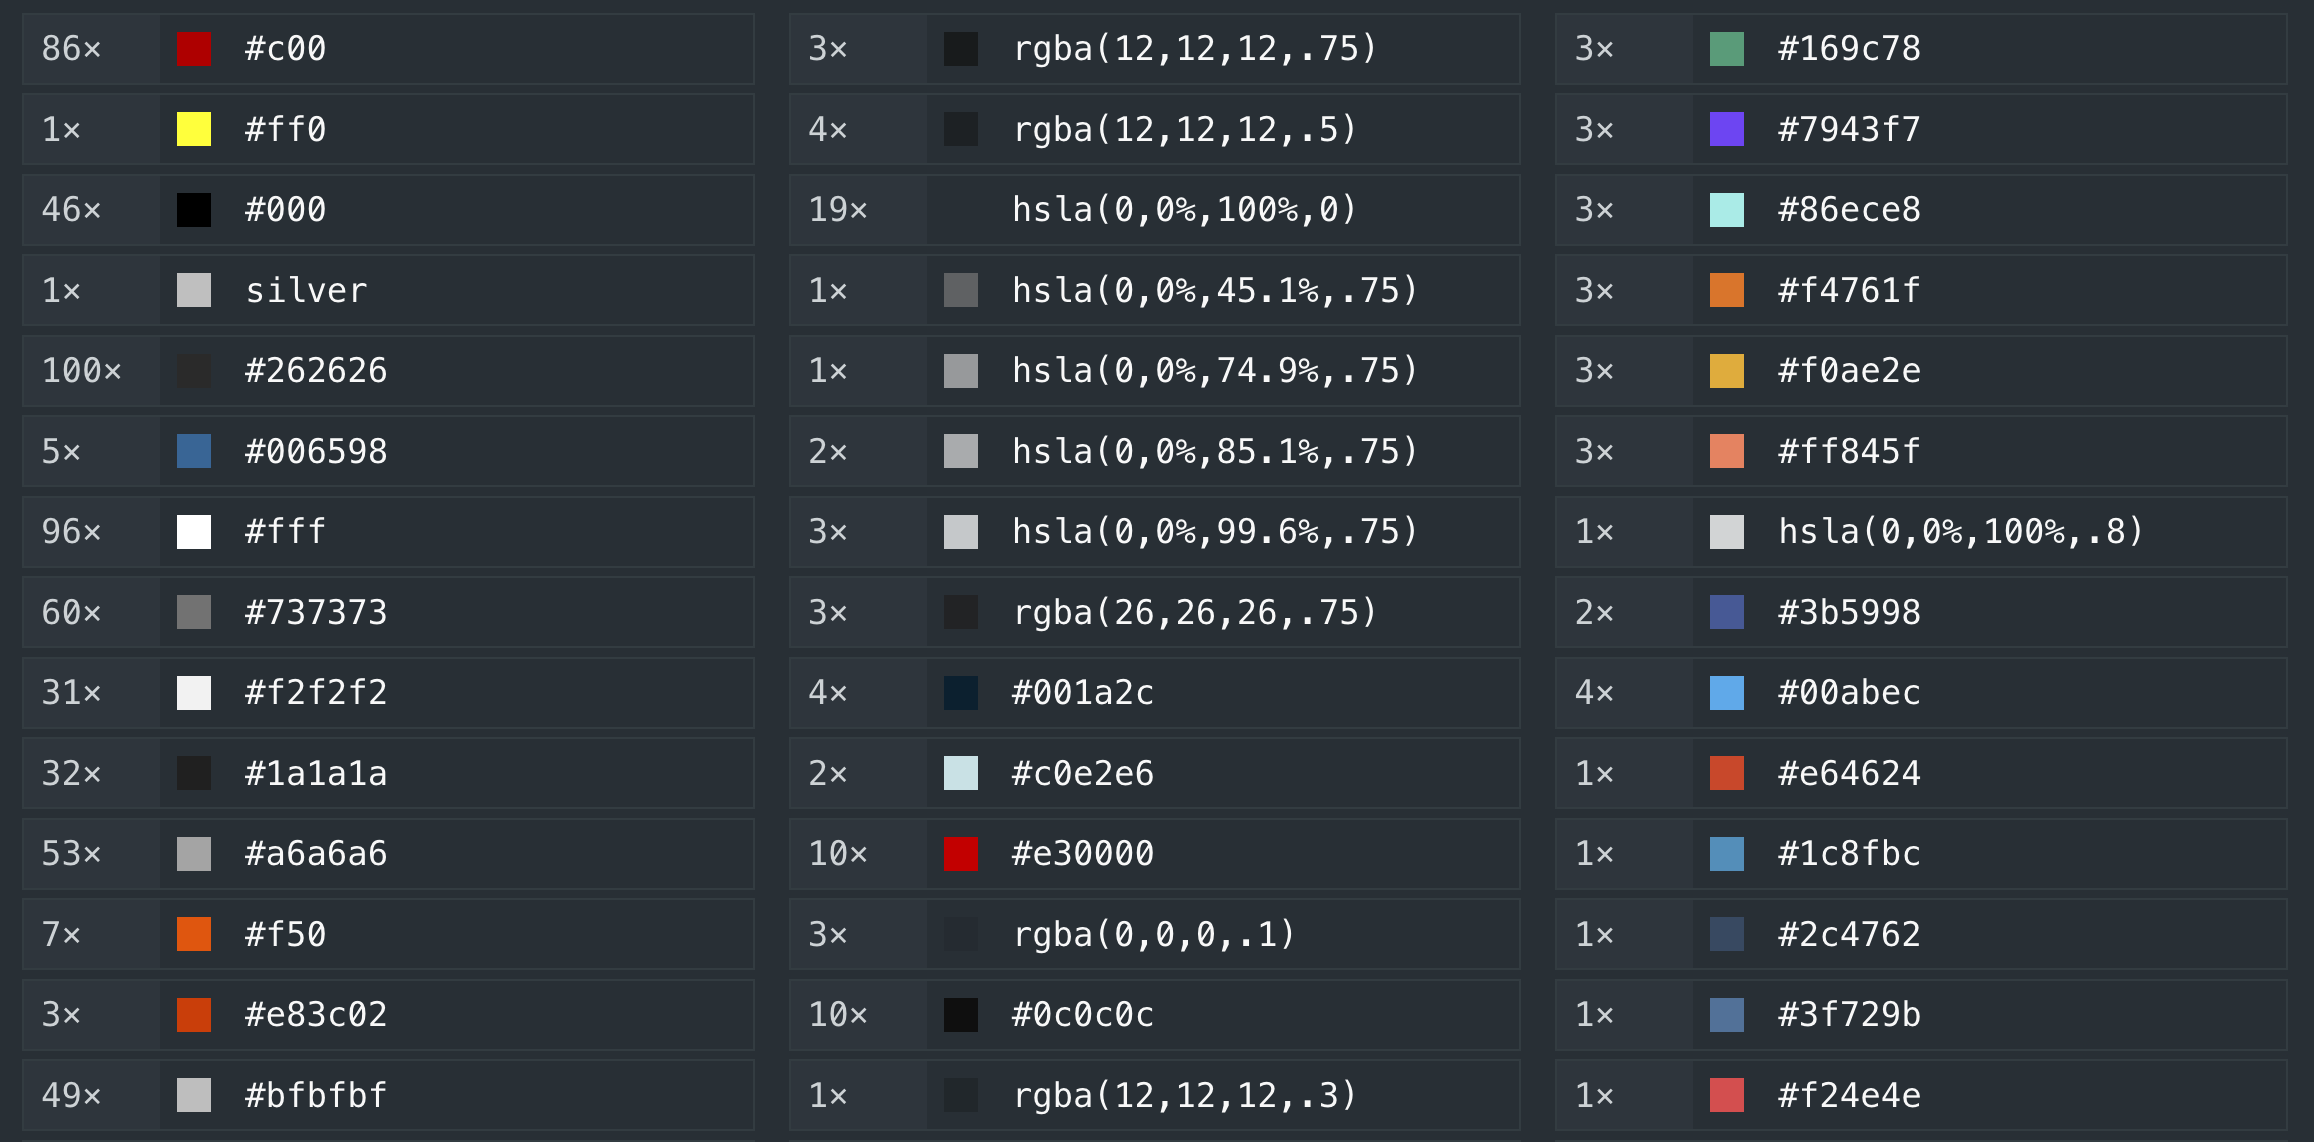
Lazily rendering Colors
Somewhere down the page there are some colors lists. They’re basically a small <canvas> where we render all known colors too. For websites with many colors this can be quite intensive, so I gave this the same treatment as the ScatterPlots: only when the Colors section of the report is scrolled into view, these canvases are rendered.
Reducing DOM nodes
One thing that is generally true for most performance-related work is the amount of DOM nodes on a page. Whether that’s for React, Svelte or even CSS selector performance. Many nodes make your app slow. In our case, the page has over 7200 DOM nodes, so we should remove a whole lot of them to make our page render faster.
Lazily rendering ColorList
Similarly to how we lazily render the scatter plots, we also lazily render the ColorList as well. For CNN it contains a whopping 504 DOM nodes for 126 unique colors (4 DOM nodes per color), so that’s a huge list of items for Svelte to skip initially.
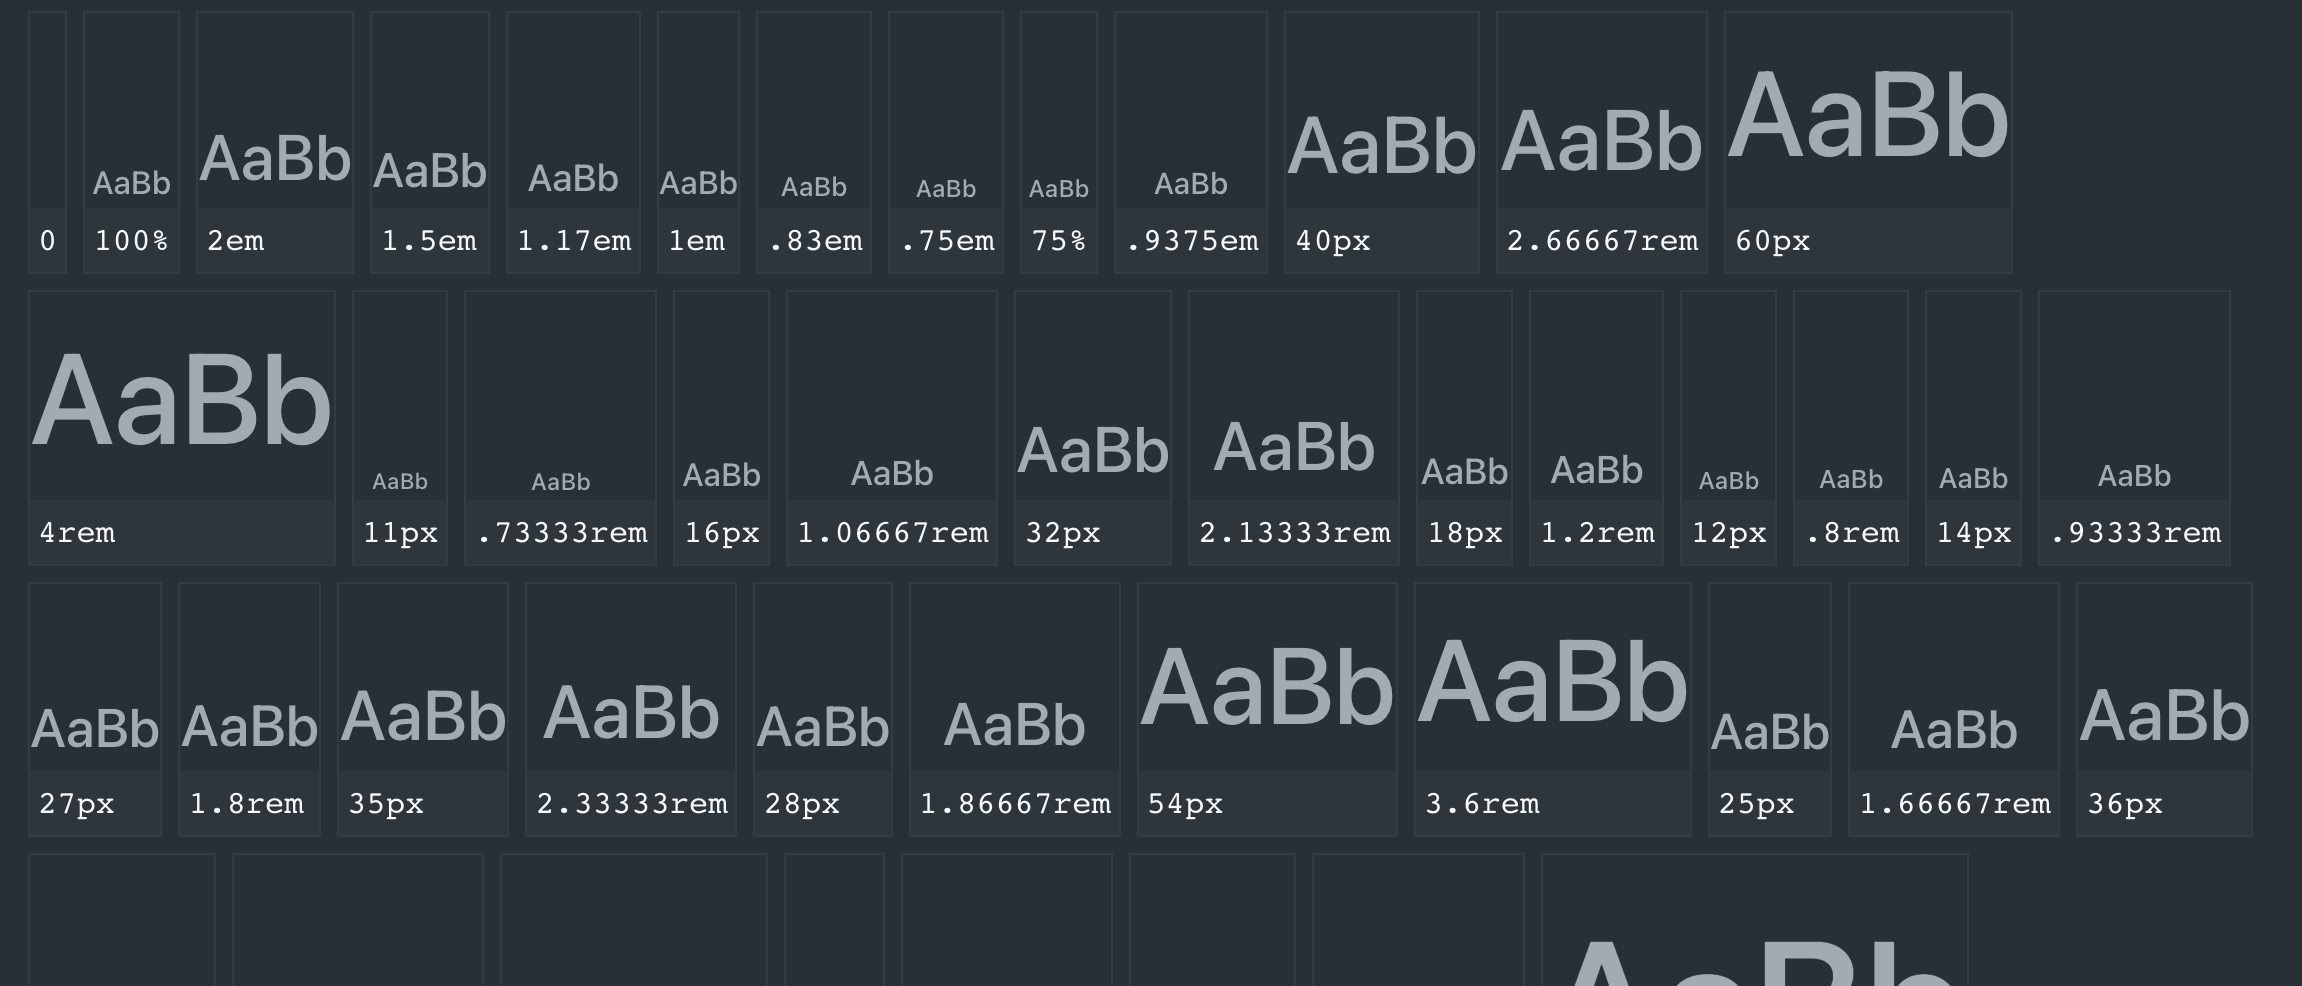
Reducing font-size nodes
CNN.com has 319 unique font-sizes which is a lot, but unfortunately a pretty common amount.
This is the (stripped down) HTML we used to generate that list (before):
<!-- FontSizes.svelte -->
<ul>
	{#each sizes as [value] (value)}
		<li>
			<!-- useless div! -->
			<div>
				<div style:font-size={value}>AaBb</div>
				<code>{value}</code>
			</div>
		</li>
	{/each}
</ul>
It wasn’t obvious immediately, because the actual implementation has more classnames and attributes, but there is a completely unnecessary <div> in there, so I took it out while maintaining the same layout, which saves us 319 DOM nodes!
Reducing DOM nodes in ShowMore components
To keep the report somewhat easy to digest, I’ve made a component that only shows the top ~15 items when there’s a long list of things. The properties-list and media queries are a good example of this. When there are many properties, like the 220 unique properties on CNN.com, we don’t want to scroll for ages to get to the next section, unless you intentionally want to view them all.
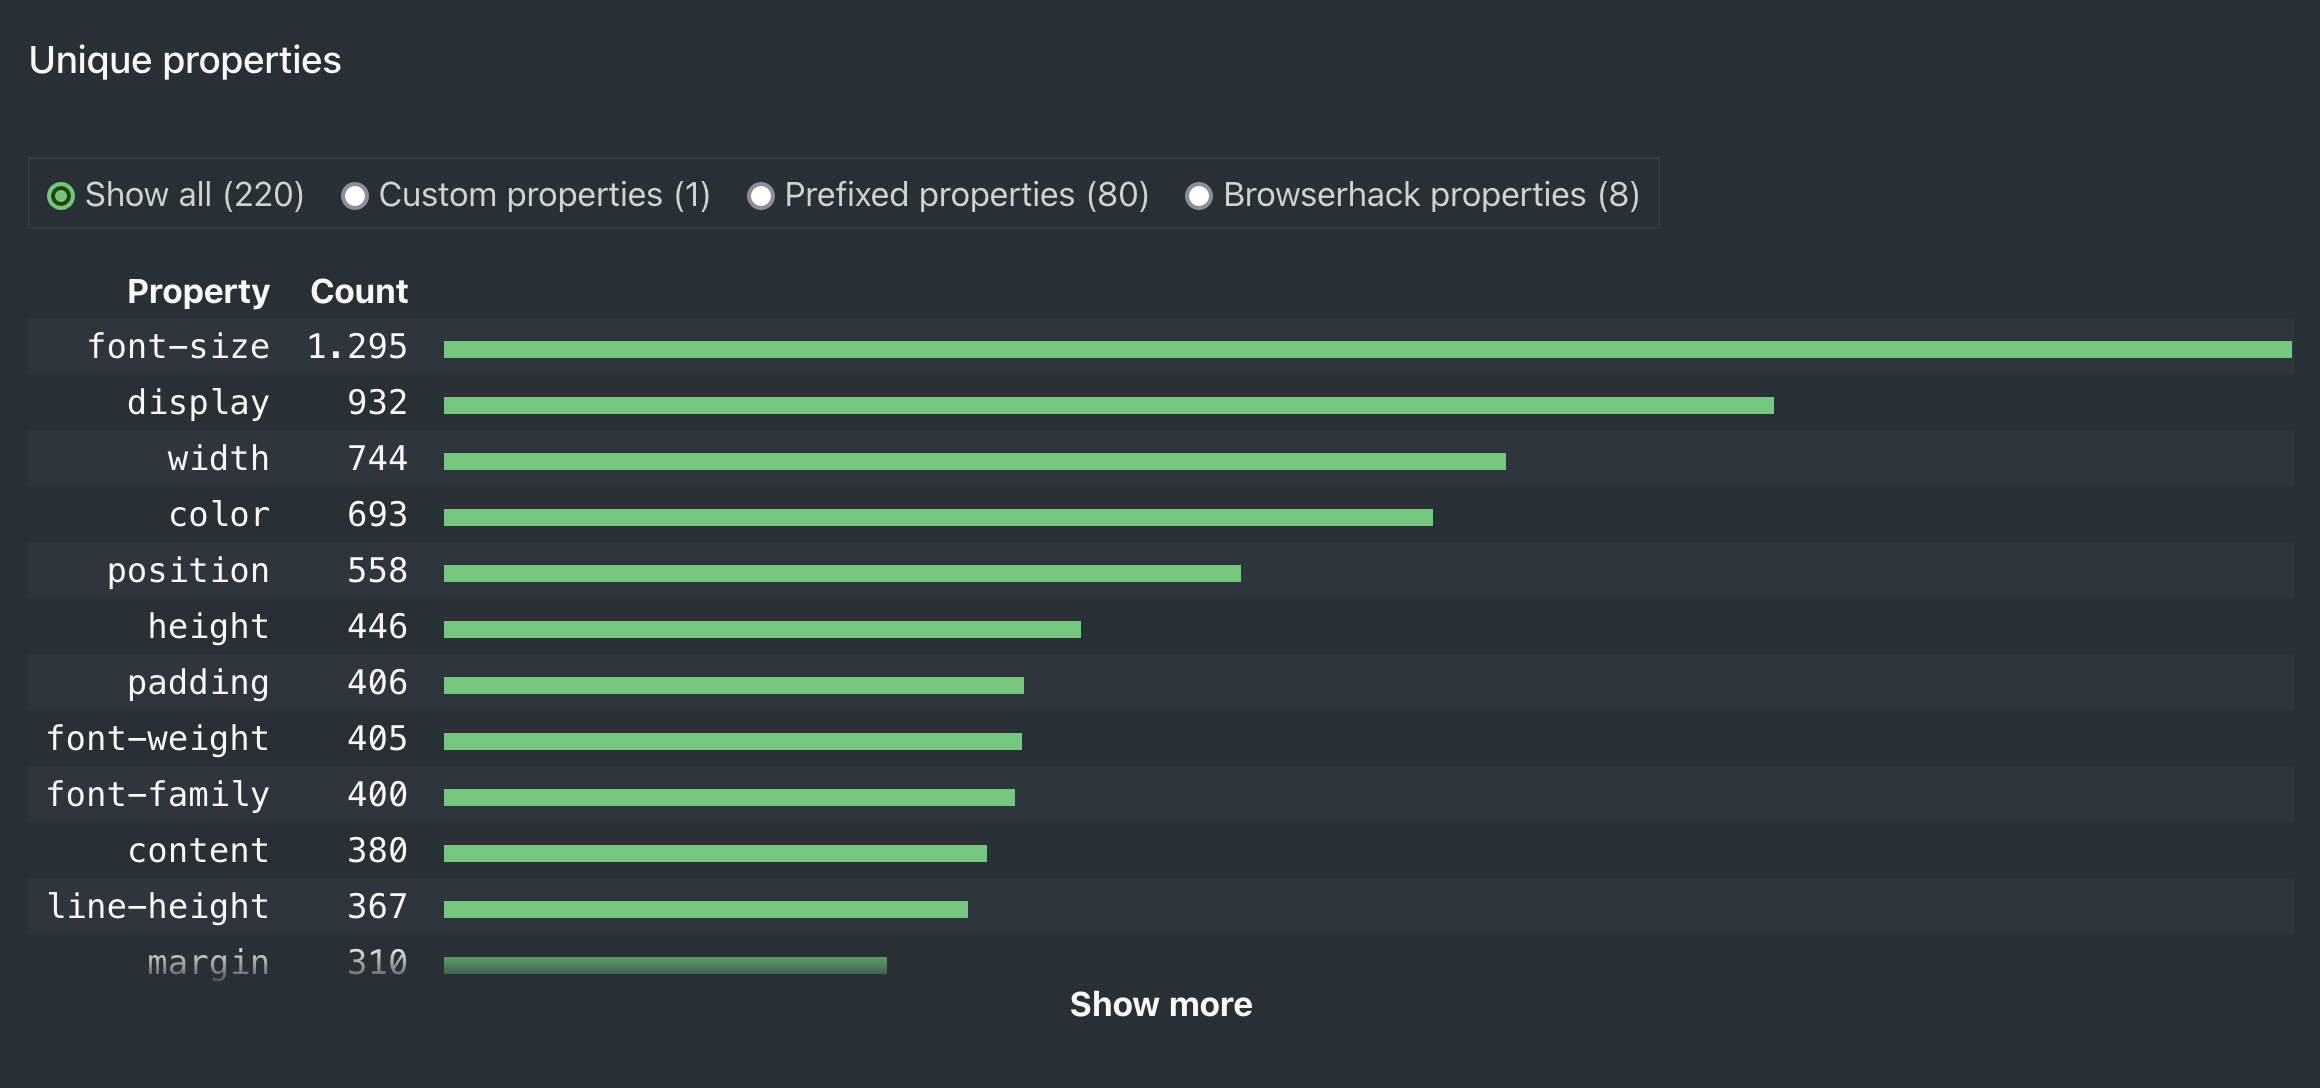
Now, before our performance upgrade, we’d render all 220 items (× 6 DOM nodes = 1320 nodes!) and hide everything after the initial 400px with overflow: hidden. What a waste! Time to be a little smarter with our rendering.
The trick here is to use Svelte slot props:
<!-- ShowMore.svelte -->
<script>
	let status = 'closed'
</script>

<div class="show-more" data-status={status}>
	{#if status == 'closed'}
		<button type="button" on:click=()}>Show more</button>
	{/if}
	<!-- pass `status` to the component using <ShowMore> -->
	<slot {status} />
</div>

<style>.show-more[data-status=closed]{max-height:400px;overflow:hidden}</style>
<!-- Properties.svelte -->
<script>
export let properties = []
</script>
<ShowMore let:status>
<table>
<thead><!-- etc. --></thead>
<tbody>
{#each properties.slice(0, status === 'closed' ? 15 : Infinity) as property}
<tr><!-- etc. --></tr>
{/each}
</tbody>
</table>
</ShowMore>In the above (simplified) components, we see that ShowMore exposes the status value back to the consuming component (Properties.svelte), so that it knows whether it’s open or closed. When closed, we slice the properties array to only render 15 rows (× 6 DOM nodes = 90 nodes, versus 1320 before). When open, we render the full list by setting the end of slice to Infinity.
The result
After these changes the Performance panel shows that a mere 262ms is needed to render the whole report, which is more than 6 times faster than before! The initial DOM node count has gone down from a whopping 7200+ to 3770, which is almost a 50% reduction! 🤯
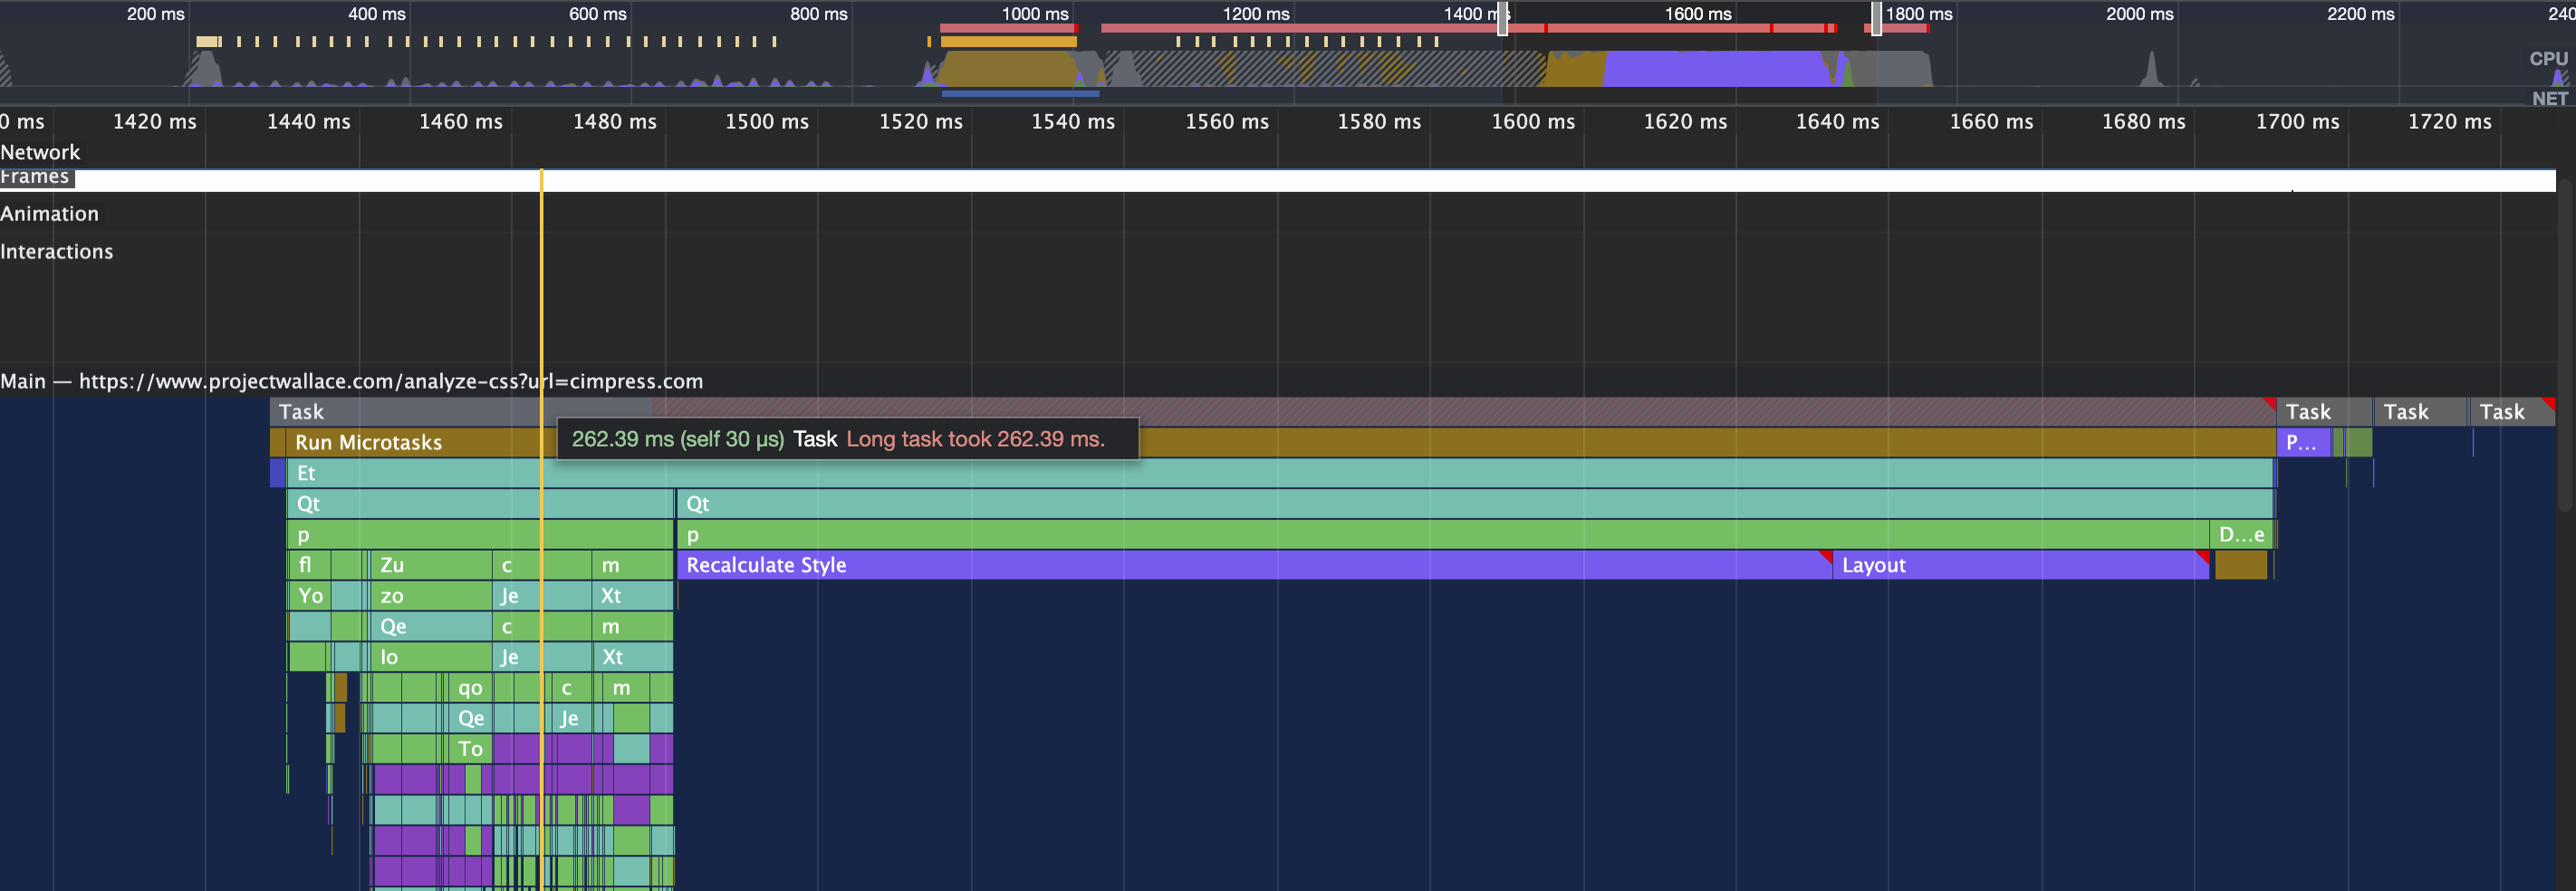
The image also shows two big blocks of Recalculate Style and Layout, taking up 150ms and 50ms. I have yet to find out what they mean, but I think it’s the document trying to paint the generated report to screen. The tall block on the left is what would previously take up all space and look at it now: it’s tiny in comparison.
Thank you
A big shoutout to Tim Vereecke and John for helping me understand what’s going on! Your feedback really helped me fix the issues and motivated me to write this post. John also found some interesting pointers to potentially speed up Pancake.svelte, but let’s leave that for another time. 😉
Popular posts
Making Analyze CSS render 6 times faster
A deep-dive in how the Analyze CSS page renders 6 times faster by applying 2 basic principles.
CSS complexity: it's complicated
There's lots of places in CSS to have complexity, but we tend to focus on selectors most of the time. Let's have a look at other places too.