How to calculate CSS code coverage with @playwright/test
One of the most common questions around analyzing CSS quality is how to detect unused CSS. Shipping unused CSS to the browser is a waste so we want to avoid it! This post shows how to collect CSS code coverage data with the help of @playwright/test.
Table of contents
- Writing Playwright tests
- Collect CSS Coverage from Playwright tests
- Bonus: Analyzing and linting CSS Coverage
Writing Playwright tests
Start with writing Playwright tests for our website. Playwright tests run in a headless browser and they emulate user behaviour to verify that your website works as intended. The Project Wallace website has 230 of these tests. Here is one of them:
import { test, expect } from './tests/fixtures'

test('Navigation: pressing Escape on the popover closes the popover', async ({ page }) => {
	let trigger = page.getByRole('navigation').getByLabel('Additional navigation items')
	let popover = page.locator('.nav-popover')

	await page.setViewportSize({ width: 420, height: 800 })
	await trigger.click()

	// Press Escape
	await page.keyboard.press('Escape')

	// Check that the popover is not visible
	await expect.soft(popover).not.toBeVisible()
	await expect.soft(trigger).not.toHaveAttribute('aria-expanded', 'true')
})
That’s just one test, but imagine you have your whole website covered by these sort of tests. Extensive test coverage is essential for calculating CSS coverage.
Notice the import of a fixture instead of the default import { test, expect } from playwright/test'. In the next step we’ll look at how to collect the data using these tests and why we use this fixture.
Collect CSS Coverage from Playwright tests
Now that we have tests, we can start collecting data! Playwright provides two functions related to CSS Coverage: coverage.startCSSCoverage() and coverage.stopCSSCoverage(). If you combine these functions with Playwright fixtures you can collect coverage data from within your Playwright tests:
type Fixtures = {
	cssCoverage: void
}

export const test = base_test.extend<Fixtures>({
	cssCoverage: [
		async ({ page }, use, testInfo) => {
			// start before test
			await page.coverage.startCSSCoverage()
			// run the test
			await use()
			// stop after test
			let coverage = await page.coverage.stopCSSCoverage()

			// write coverage to disk
			await fs.writeFile('path-to-file.json', JSON.stringify(coverage))
		},
		{ auto: true }
	]
})
You can peek at our implementation on GitHub. That one is a bit more involved because it automatically generates a unique file name for each coverage file and attaches it to the test.
Let’s break it down:
Creating the fixture
This creates the actual fixture and it tells Playwright to automatically set up this fixture for every test.
type Fixtures = {
	cssCoverage: void
}

export const test = base_test.extend<Fixtures>({
	cssCoverage: [
		async ({ page }, use, testInfo) => {
			// etc.
		},
		{ auto: true }
	]
})
Collecting coverage
The core of the fixture is surprisingly small! Start collecting, run the test and stop collecting.
// start before test
await page.coverage.startCSSCoverage()
// Run the test
await use()
// stop after test
let coverage = await page.coverage.stopCSSCoverage()
Write coverage to disk
To be able to use the coverage data later on we need to write it to disk. In practice you’ll give this JSON file a unique name, probably the name or path of your actual test.
await fs.writeFile('./css-coverage/path-to-file.json', JSON.stringify(coverage))That’s all! Because of the auto-fixture every test will now self-report all CSS Coverage data.
Bonus: Analyzing and linting CSS Coverage
After running our 230 Playwright tests we have megabytes of coverage data that we can start analyzing. As you could read in my previous blog post there are a lot of gaps to fill. On top of that many tests report the same coverage ranges for the same files so there is also a lot deduplication to do. And prettifying the CSS because no-one likes inspecting minified CSS. This is where our new @projectwallace/css-code-coverage package comes in handy. It does all that for us and generates handy statistics. It even ships with a CLI that works as a CSS Coverage linter!
The previous step generated a /css-coverage folder full with 230 JSON files. We’re going to use @projectwallace/css-code-coverage to make sure that our coverage is at an acceptable number:
css-coverage --coverage-dir=./css-coverage --min-line-coverage=.9 --min-file-line-coverage=.7 --show-uncovered=allSee our implementation here as a package.json script.
This command:
- Tells the linter that our coverage JSON files live at
./css-coverage - Sets the threshold for line coverage to .9 (or 90%) meaning that at least 90% of all lines of CSS combined must be covered
- Sets the threshold of file line coverage to .7 (or 70%) meaning that each individual CSS file must at least have 70% line coverage
- Instructs the linter to report all CSS files that don’t have 100% coverage
This is the result when running it for projectwallace.com’s repository:
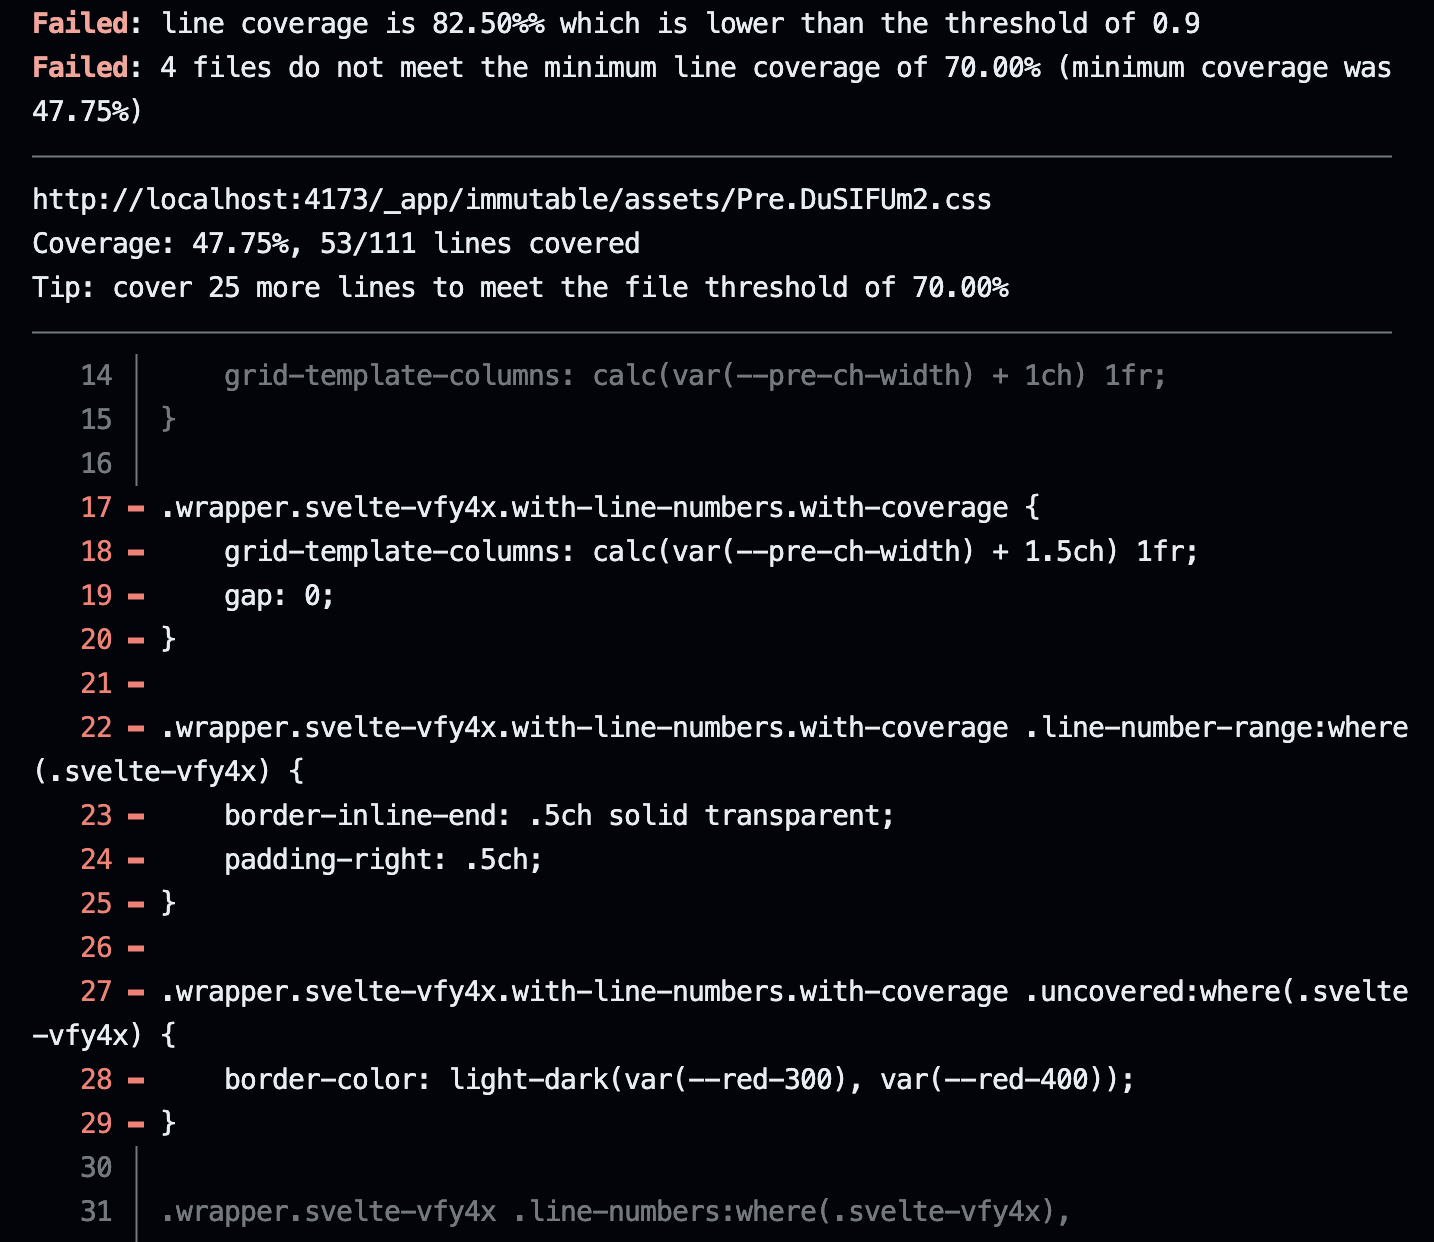
The @projectwallace/css-code-coverage package focuses on lines and not on bytes because as developers we also look at lines of code.
Running this CLI in a GitHub action after the Playwright test gives you have accurate test data in each run and helps you catch shipping unused CSS!
Popular posts
Making Analyze CSS render 6 times faster
A deep-dive in how the Analyze CSS page renders 6 times faster by applying 2 basic principles.
CSS complexity: it's complicated
There's lots of places in CSS to have complexity, but we tend to focus on selectors most of the time. Let's have a look at other places too.